Inlet Metering Valve (IMV) Duty Cycle with Maths Channel
Vehicle Diagnosis requires a Diagnostic Scope
There can be no hiding from the fact that during a vehicle diagnosis we are going to need a diagnostic scope. This lesson teaches you how to diagnose faults in an Inlet Metering Valve.
This may be to ~
- Confirm the operation of a component
- Observe the response time of a sensor
- Verify a parameter from a serial scan tool data list
These are just a few automotive scope applications.
It is the latter I would like to discuss here - verifying parameters - as we are often presented with a frequency or duty cycle value when looking at solenoid valve control signals.
Take for example the inlet metering valve (IMV) located on the diesel pump of a common rail system (the IMV receives a 12V DC ignition supply and is grounded via the PCM).
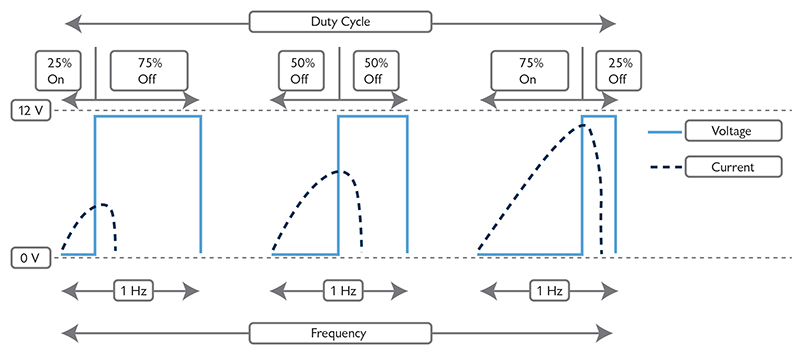
Using a Pulse Width Modulated signal (PWM) we can infinitely control the position of the IMV by varying the frequency of the DC ground signal. For a given frequency we can also control the current flow through the IMV by modulating the on/off time of the ground signal (duty cycle).
The image above highlights how the frequency can remain constant but the duty cycle can be modulated to control the current flow. In automotive applications the on time is usually 0V as the signal wire is grounded via the PCM so allowing current to flow.
A typical scenario to demonstrate IMV control
The driver of our diesel vehicle accelerates hard from stationary and so maximum diesel common rail pressure is vital. The IMV is urgently required to open so allowing an increased volume of fuel into the pump resulting in a high fuel pressure output, so meeting the driver's demand for maximum power.
Looking at scan tool live data for the IMV we can see the frequency or duty cycle value change but we are unable to plot the transition. There are some scan tools that can display the frequency change in the form of a line graph but the update speed will be questionable at best and any intermittent drop out within the signal would be missed, resulting in prolonged diagnosis.
So how can the oscilloscope plot the change in the frequency and duty cycle control of the IMV?
For plotting frequency the answer is twofold, either ~
- using the built-in frequency coupling feature within the hardware of the scope - 4000 Series Automotive PicoScope only or
- A math channel incorporated in the software - any PicoScope
For plotting duty cycle, an additional math channel is utilized within the software.
When plotting frequency using the frequency coupling option, the technician connects the scope to the signal wire of the IMV (DC coupled) and selects the appropriate timebase to capture the acceleration event of the customer.
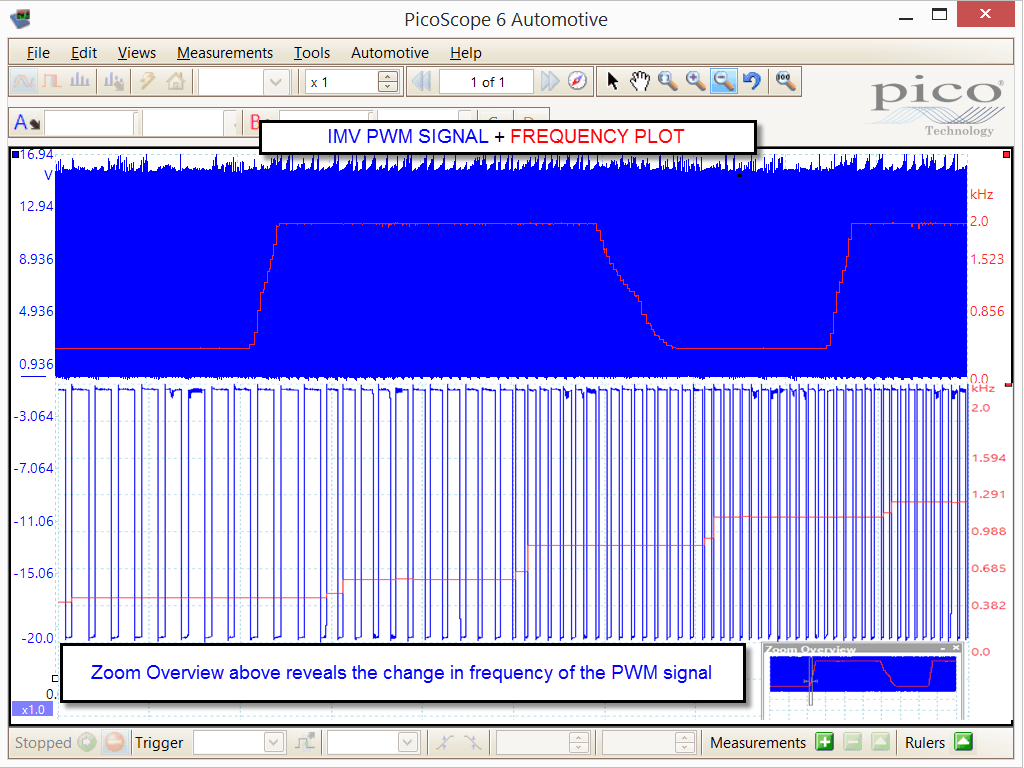
Using a second channel connected to the same signal wire (frequency coupled), the scope can measure and plot the frequency control of the IMV and display this data in real time on screen. The technician can now evaluate the response time and control of the IMV in relation to gas pedal position while monitoring the effects upon other applicable signals such as fuel pressure.
The image above demonstrates how the scope has captures the PWM signal (blue trace) whilst plotting the frequency (red trace) in real time.
An alternative to utilizing the frequency coupling option is the math channel feature. Here the technician has the facility to create numerous math channels to carry out any desired calculation to any input signal applied to the scope. One advantage of utilizing math channels is that they can be applied post-capture allowing the technician to evaluate the signal away from the vehicle and turmoil of the workshop.
Creating a Maths Channel
In the case above we have a square wave signal controlling the IMV that will vary in both frequency and duty cycle. We therefore need to create two different math channels to plot the change in both these events.
To calculate the frequency of our IMV, the signal must past through zero volts (crossing point), yet our signal travels from 0V to 15 V. A tip therefore is to split the signal in half (7.5V) and use this value as follows in the formula you are about to create. We use “-7.5” to effectively move the zero crossing point into the middle of the PWM signal. This allows the math channel to calculate the number of crossing points in a given time to display the frequency - in other words, the number of times the signal crosses 7.5V.
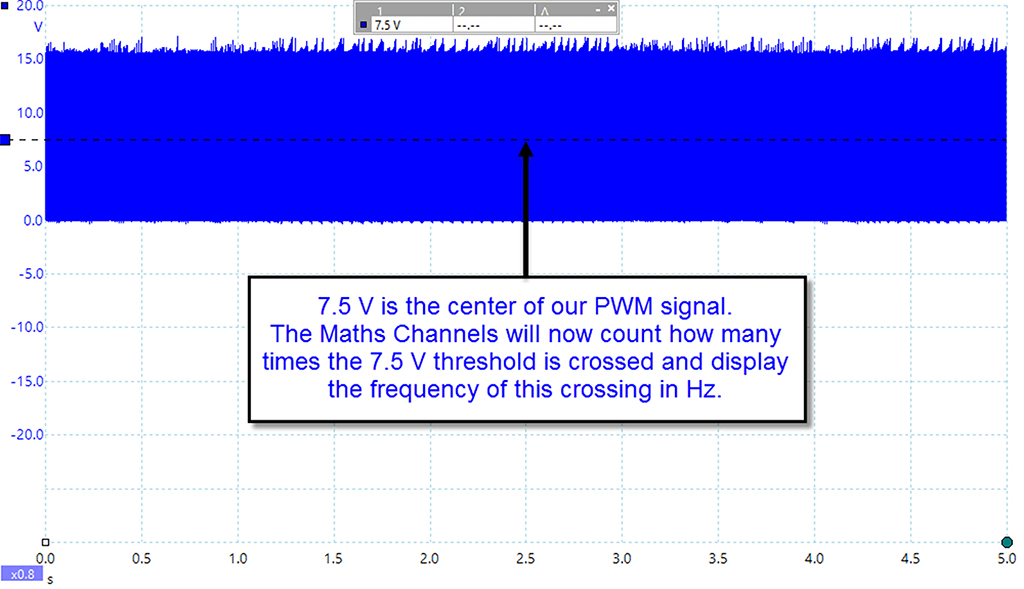
In the PicoScope software select Tools > Math Channels and then Create. Click Advanced and then the "freq" button. When "freq( )" appears in the formula box, put your cursor between the two brackets "( )" and type A-7.5. The whole formula will look like freq(A-7.5).
Click Next, and choose any colors, names, and ranges. It is best at this stage to set a manual override to the actual frequency range you require (in the example below I have selected 0 Hz to 2000 Hz) and finally click Finish. Check the box next to your created math channel and click OK.
A new third (math) channel will appear and will plot the frequency of the IMV signal on the channel you have requested (In this case, freq(A-7.5) is a frequency maths channel for channel A, our IMV PWM signal).
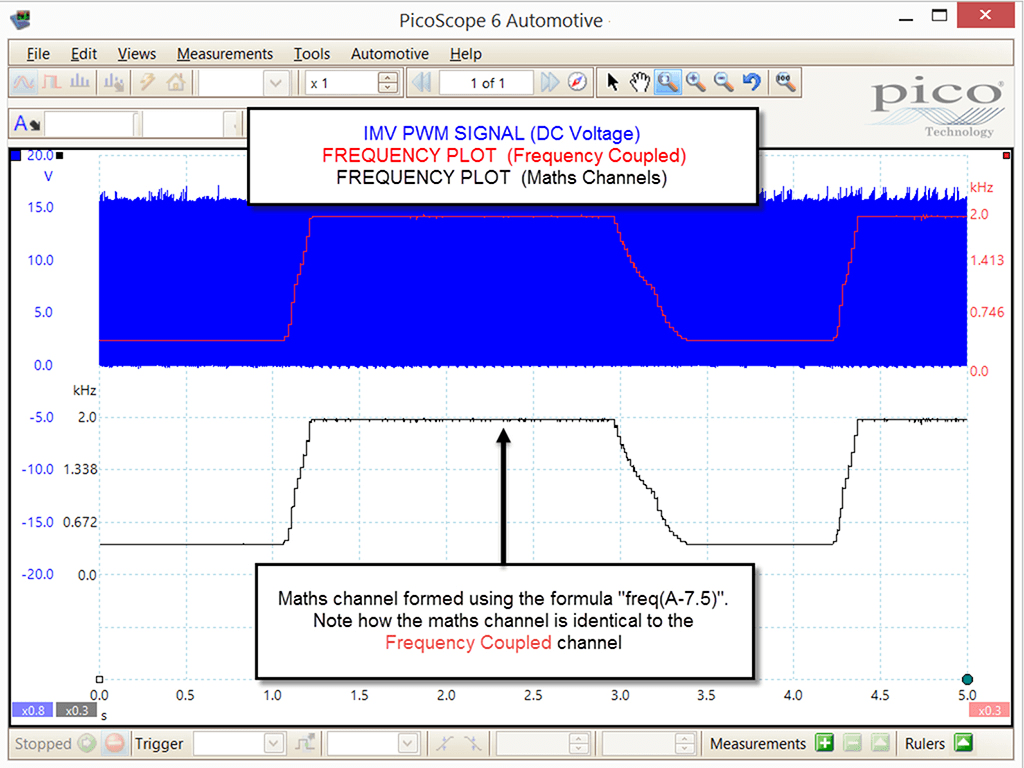
Now we need to add a duty cycle measurement to complete the whole task to reveal even more information about our PWM signal.
Once again from the Tools drop-down menu, select Math Channels then click Create. From the equation editor select Advanced and then click the Duty button followed by the letter of the channel you want to use (in the example below we have used channel “-A”) then click Next.
NB. Given our IMV valve is switched to ground via the PCM our on-time is present when the voltage is at 0 V (PCM grounds the IMV and current flows).
For this reason we need to read the negative duty cycle and not the positive. Placing a “-“ sign in front of Channel “A” in our duty cycle formula duty(-A) informs the software to display the negative duty cycle as indicated by your scan tool data list, allowing you to make a direct comparison.
If you are happy with the default colours and name click Next.
If you are happy with the default range (0 to 100%) click Next.
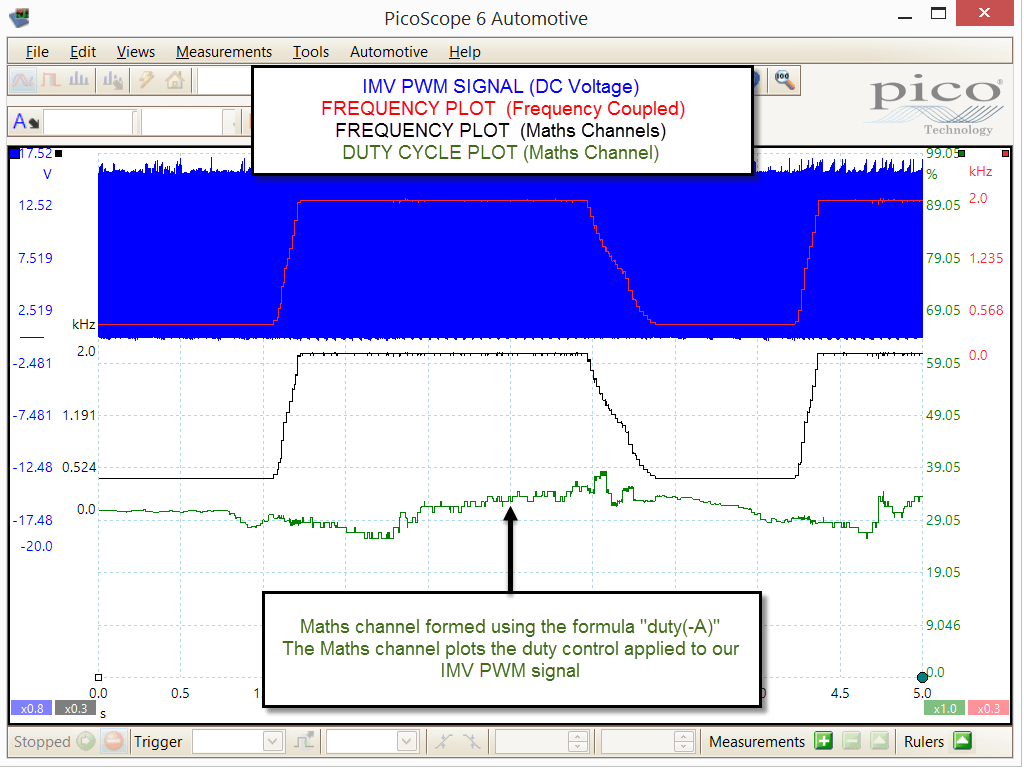
Below we can now see all additional channels on one screen:
- Channel A: PWM DC-coupled signal
- Channel B: frequency-coupled signal measuring the frequency of our PWM signal in hardware
- Math channel: measuring the frequency of our PWM signal in software
- Math channel: measuring the duty cycle of our PWM signal in software
As you can see, from what originally started as single connection to capture the PWM signal of the IMV, using the hardware and software features of PicoScope we have revealed vital information about the behaviour of the PWM. Here we can capture signal drop-out (at lightning speeds) while making comparisons with other signals such as gas pedal position and fuel rail pressure.
Using the memory function of PicoScope, the vehicle can be road-tested and the data recorded for evaluation after capture. This feature alone protects the safety of all road users whilst the technician ensures no data is lost.
The question then, is “How can you afford to diagnose without a PicoScope?”

