
Audi A8 Fusebox Diagnostics
Introduction
Oscilloscopes are widely used in diagnostics for the simple reason that they save time and money. This article aims to give some advice to help you use your scope more effectively, so saving more time and money. When using an oscilloscope to test a component, there is often a choice of either making a voltage measurement or sensing the current waveform using a current clamp. This can even be done by using a fuse breakout in the fusebox.
Current & Voltages in an Injector Circuit
When making voltage measurements you have to think about where you measure the signal, as the voltage can be different in different parts of the same circuit. A simple rule is that when measuring sensors (like cam and crank) you should measure as near to the ECU as possible and when measuring actuators (such as injectors and throttle motors) you should measure as close as possible to the actuator.
The theory behind this is that, when looking at a sensor such as a crank sensor, what counts is the signal that the ECU sees. The sensor might be functioning, but if the problem is within the wiring loom the ECU may be getting no signal at all. Similarly, where the ECU is outputting a signal to control an actuator (such as an injector), you should ideally check the voltage signal near the component.
While the above rule makes sense in theory, it often falls down in practice. In many cases ease of access takes priority, so you tend to grab a measurement where it’s quick and easy rather than in the ideal location. Your instinct is always to save time and money.
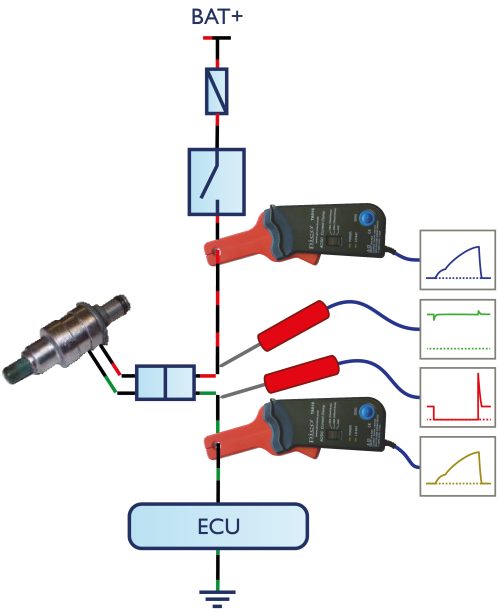
While voltage can vary across a series circuit, current does not, so you have more options of where to measure (Figure 1). If testing an injector, for example, there is a temptation to test the current at the injector even if this means spending time removing covers and getting access to a wire.
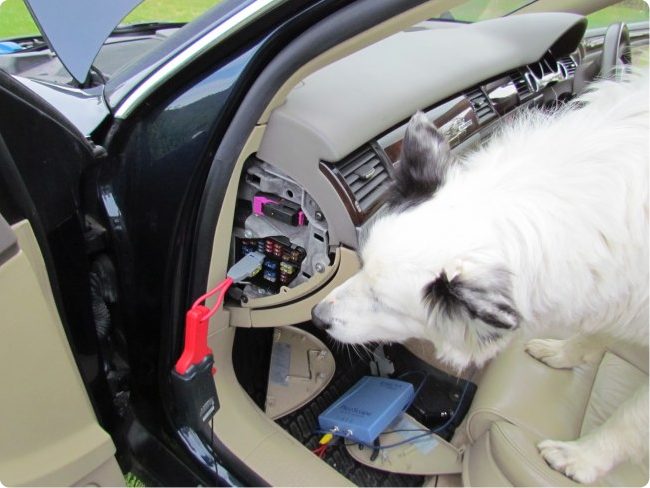
60A Current Clamp being used with the Fuse Breakout Lead
Furry diagnostic assistant optional!
A better option is often to measure current at the fuse box using a current clamp where you have easy access to lots of circuits in one place (Figure 2). With a bit of experience you can sometimes diagnose a car (or confirm a code from a scan tool) without even opening the bonnet or hood.
There are however a few limitations when measuring current from the fuse box. The first is that it will only work for components that draw a significant current, which limits it to actuators such as fuel pumps, injectors and ignition. It will not work for most sensors, so these need voltage testing.
The second limitation is that, while the label for a fuse might say ‘injectors’, it sometimes really means ‘injectors and a bunch of other stuff’.
To minimise the chance of confusion due to multiple circuits on the same fuse, we advise always starting with a timebase of at least 20ms/div across the screen. This ensures there is enough time to observe a complete engine cycle at a normal idle speed.
Sometimes having more than one circuit on a fuse can make understanding a signal more complicated, but on other occasions it can actually help. Some Toyotas, for example, share a fuse for injectors and ignition and this lets you see all injectors and ignition coils fire just by probing one location. When you think this through, it makes sense from the car owner’s point of view. There is no advantage for the customer having separate fuses for the injectors and ignition coils: if either fuse blows, the engine stops.
Let’s look at a few examples taken from an Audi A8 with a 4.2L V8 petrol (gasoline) engine. As well as the oscilloscope, all you need is a “low amps” probe and a fuse breakout lead. The value of the fuse you remove to fit the breakout lead gives you a good clue as to which range to set the scope to measure (if you removed a 20A fuse, set the scope to measure 20A).
Lambda (oxygen) Sensor Heater Circuit
Most modern lambda sensors have heater circuits so that they can quickly get up to operating temperature. In our experience, problems with the heater circuit are as common as those with the sensor itself.
Lambda sensors, due to their location in the exhaust system, are often difficult to get to so it’s much quicker (and more comfortable) to get at the signal from the comfort of the passenger cabin.
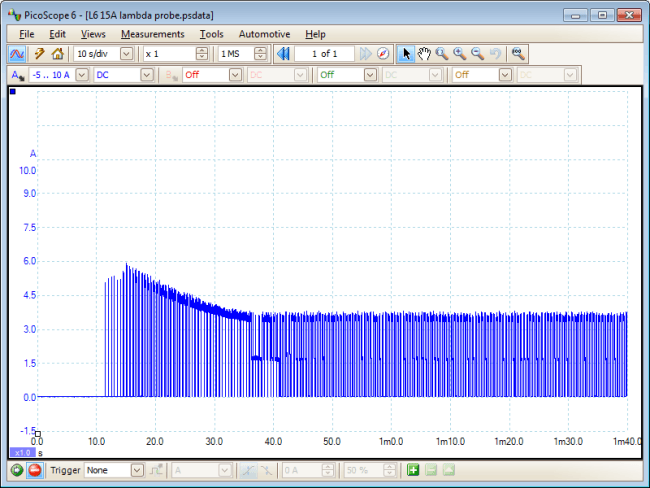
The heater circuit in this example is fairly typical, in that the ECU controls the amount of heating by rapidly switching the heater on and off. The more time it’s on, the more heating we get. Once the engine has been started, the peak current jumps to about 6 amps and if you zoom in you can see that the heater is on more than it is off. After 30 seconds or so the sensor has warmed up and the current drops a bit, to about 4 A. This is because the heating element when warm has a higher resistance than when cold (this is the same as a light bulb: when cold they draw more current so often fail when first switched on). At the same time, the duty cycle of the switching signal has changed and the heater is now switched off for more time than it is on.
On this Audi, care is needed in performing this test as the same fuse supplies two heater circuits. If you look closely at the waveform you can see areas where only one of the heater circuits is switched on giving a reading of about 2A.
Injectors
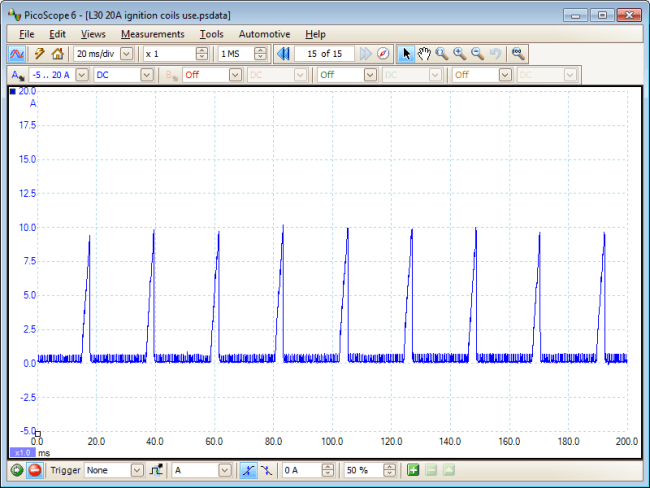
The main advantage of testing injectors from the fuse box is that you can see and compare all of them at once: a real time saver on a V8 or V12.
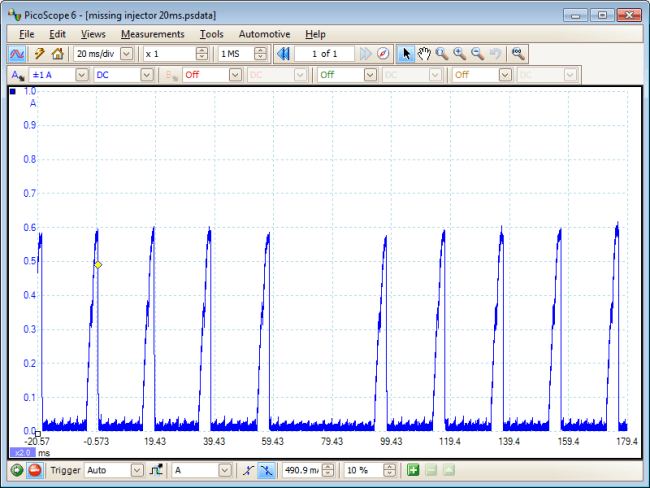
As we want to see at least one complete engine cycle (two engine revolutions, so all injectors fire) we have chosen a timebase of 20 ms/div. It’s fairly obvious that this vehicle is only firing on seven cylinders, but be careful before leaping to any conclusions. Often, if an ECU detects a misfire, it will disable the injector of the offending cylinder to save the catalytic converter being damaged by the unburnt fuel.
If you see a waveform like this, try capturing another one just after the engine is switched on. The ECU will not disable the injector until it has detected a misfire, which takes several seconds. If you see all eight injectors but then one drops out, it’s very likely that the ECU is disabling the cylinder. This would lead me to suspect either an ignition or a mechanical issue. Fortunately, both of these problems can also be tested using a current clamp as described later in the article. In this case the vehicle did not have any real issues, so I unplugged the injector to make the waveform more educational.
As well as a gross error such as an injector not firing, it’s worth zooming in on each injector event to look for more subtle issues by checking that the waveform from each one looks identical. The waveform shown below is such a zoom: the dip in the waveform is the moment that the solenoid (pintle) inside the injector moves and fuel begins to be injected. If this is missing from one injector, it’s usually a sign that the injector is either stuck closed or open. It’s also worth checking that this dip happens in about the same place for each injector. If it’s early (usually a weak spring in the injector) then too much fuel will be delivered; if it’s late (sticky injector) then too little fuel is being delivered.
As well as the timing of the pintle movement, check that current amplitude is roughly the same for each injector, as if one injector is drawing more current the coil may be breaking down. Also check that the time duration is about the same for each injector. If one injector duration is longer or shorter than the rest then the ECU is trying to compensate for a lack of power from that cylinder, so you need to find out why.
Ignition
Checking ignition on this car is very similar to testing the injectors as it has one coil for each cylinder (Coil on Plug). Again, as we can see all the cylinders firing on the same waveform, it’s a case of comparing to look for any differences.
This vehicle seems to be one of those where the fuse marked “ignition” is really for the “ignition coils and a bunch of other stuff”. In this case it shows up as small (500mA), rapid (2kHz) spikes in the current that give the waveform a noisy appearance.
The correct approach here is to check the wiring diagram to see what is causing these spikes, but on this occasion I decided I still had a clear enough view of each ignition event to assume each ignition coil was firing. Within PicoScope software you can always switch on the low–pass filter to remove such noise if it bothers you.
Fuel Pump
The fuel pump is another component where access is usually difficult. Changing a fuel pump based on a wrong diagnosis can really ruin your day. Again, if measuring from the fuse box, start off at 20 ms/div then either zoom in or change the timebase so that you see the waveform as shown.
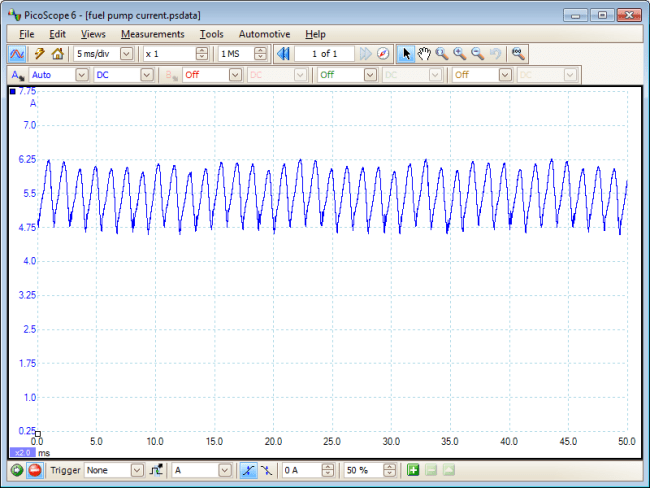
We want to check two things on this waveform. First is the average current, which in this case is about 5.5 amps. This is the value you would get if you used a multimeter to measure the current. If you suspect problems with the fuel pump, many data sources give typical currents for a given application. If the current is outside the recommended range then, before condemning the pump, check the rest of the fuel system. A blocked filter, for example, makes the pump work harder, increasing current flow. A faulty fuel pressure regulator, on the other hand, can reduce the current.
The current pulses are caused by the individual sectors of the commutator in the pump’s electric motor. Most pumps have 6 or 8 sectors. If one sector gives a significantly different waveform (often dropping to near zero amps) then it’s bad news: the pump is on its way out. This sign of impending doom is often impossible to spot just by measuring the current using a meter, which does not respond quickly enough to the drop in current.
Electronic Parking Brake
This waveform shows the brake first being engaged. You will see spike in current before the motor starts moving (over 20 amps in this case), then an area of fairly low current of about 1.6A where the motor is taking up the slack space between the brake pad and disk. The current then rapidly increases as the pad is pushed against the disk, with a peak current of about 18A.
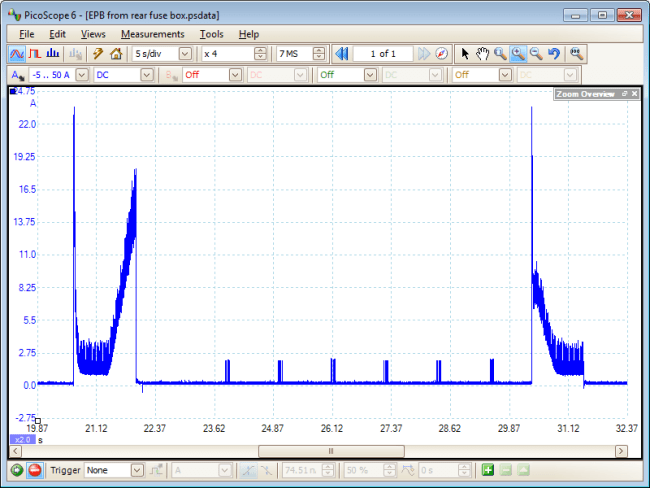
When the brake is disengaged, the process is reversed. You have the same spike in current followed by about 8 amps decaying away as the pad moves away from the disk. As with the ignition example, this waveform seems to have similar spikes of current. In this case the pulses are part of the correct operation of the EPB as about once a second it performs a self–test.
This Audi has EPBs on both rear wheels, so the best approach is to capture waveforms from both sides and then compare. The reference waveform option in the PicoScope software is ideal for this. You need to check that the currents for the engage and disengage waveforms are similar and that the times are also similar. If the brake on one side takes longer to engage than the other, it’s worth checking that the pads are not worn unequally.